Portfolio collection
Daily social mapping project happening every November↵
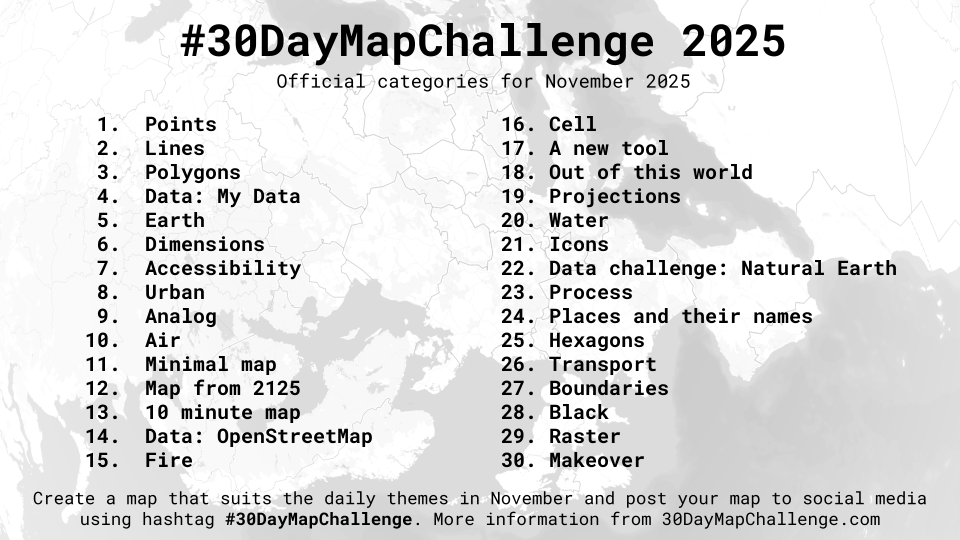
The official repository for #30DayMapChallenge, a daily mapping challenge open to everyone.
| Date | Name | Description |
|---|---|---|
| 01-11-2025 | Points | Challenge Classic: Map with point data (e.g., individual locations, points of interest, clusters). Focus on effective symbolization and density visualization. |
| 02-11-2025 | Lines | Challenge Classic: Map linear features (e.g., roads, rivers, migration paths, flow lines). Explore line thickness, color, and direction to convey information. |
| 03-11-2025 | Polygons | Challenge Classic: Create a map focused on area features (e.g., administrative regions, land use, boundaries). Use fills, patterns, and choropleth techniques. |
| 04-11-2025 | Data challenge: My Data | Map something personal using your own dataset. Visualize GPS traces, your commute, or a unique, small dataset you created. (Need simple data? Try geojson.io) |
| 05-11-2025 | Earth | Classical Elements ¼: Focus on the tangible and grounded. Map landforms, geology, soil, agriculture, elevation, or anything solid beneath your feet. |
| 06-11-2025 | Dimensions | Map beyond 2D. Visualize data using 3D models, extrusions (building heights), depth, time (as a dimension), or an unconventional multivariate approach. |
| 07-11-2025 | Accessibility | Map how people (or things) get around. Visualize travel time, barriers, inclusive design, public transport reach, or create a map that is itself highly accessible to all users. |
| 08-11-2025 | Urban | (World Urbanism Day) Map the built environment: dense street networks, highrises, urban sprawl, city infrastructure, or population density within a metro area. |
| 09-11-2025 | Analog | Step away from the screen! Create your map using traditional methods (e.g., pen, pencil, paint, collage, physical models). Show the handmade process! |
| 10-11-2025 | Air | Classical Elements 2/4: Focus on the atmosphere. Map weather, wind patterns, air traffic, pollution, or airborne transmission (e.g., pollen, sound). |
| 11-11-2025 | Minimal map | Challenge yourself to use the fewest possible elements (color, line weight, labels) while keeping the map clear, useful, and informative. |
| 12-11-2025 | Map from 2125 | How will maps look 100 years from now? Create a speculative map of what might be (or what you hope will be). |
| 13-11-2025 | 10 minute map | Start the timer! The maximum allowed time to design and produce this map is 10 minutes. Focus on speed, simplicity, and core communication. |
| 14-11-2025 | Data challenge: OpenStreetMap | Use OpenStreetMap (OSM) data as your primary source. Map your favorite feature, contribute back to the project, or style the map in an interesting way. |
| 15-11-2025 | Fire | Classical Elements ¾: Focus on energy, light, or transformation. Map heat, wildfires, energy consumption, population density at night, or volcanic activity. |
| 16-11-2025 | Cell | Map something composed of small, discrete units or networks. This could be a geographic cell (raster, tessellation), a cellular network, or a biological/social process (e.g., disease spread). |
| 17-11-2025 | A new tool | Challenge Classic: Experimentation is key! Create your map using a software, language, library, or technique you have never used before. |
| 18-11-2025 | Out of this world | Map something non-Earth: a fantasy realm, an exoplanet, the Moon, Mars, deep space, or a purely conceptual place (e.g., a mental map). |
| 19-11-2025 | Projections | (GIS Day) Focus entirely on map projections. Choose an unusual or misunderstood projection to highlight a theme, or visualize distortion. (See xkcd.com/977) |
| 20-11-2025 | Water | Classical Elements 4/4: Focus on the fluid. Map hydrology, oceans, currents, water accessibility, sea level rise, precipitation, or anything aquatic. |
| 21-11-2025 | Icons | Create a map where icons, pictograms, or custom symbols are the main focus. Use them to highlight points of interest or replace traditional cartographic features. |
| 22-11-2025 | Data challenge: Natural Earth | Use the Natural Earth dataset as your primary source for a visually stunning small-scale world or continent map. |
| 23-11-2025 | Process | Show how you make a map. This could be a tutorial, a step-by-step graphic, a blog post, a video, or a screenshot of your work environment. Combine it with a map from another day! |
| 24-11-2025 | Places and their names | Focus on toponymy (place names). Experiment with font choices, label placement, typography, multiple languages, or the history and meaning behind a name. |
| 25-11-2025 | Hexagons | Challenge Classic: Use hexagonal binning (hexbins) or a hexagonal grid system to visualize your data. Celebrate this beautiful and efficient tessellation! |
| 26-11-2025 | Transport | (World Sustainable Transport Day) Map mobility, traffic flow, public transit networks, logistics chains, or advocate for sustainable transport options. |
| 27-11-2025 | Boundaries | Map lines of division—political, physical, ecological, or conceptual. Explore the meaning and impact of a dividing line, real or perceived. |
| 28-11-2025 | Black | (Black Friday) Interpret the theme of Black. The map can be purely monochromatic, represent absence/darkness (e.g., light pollution), or relate to themes of consumption. |
| 29-11-2025 | Raster | Challenge Classic: Map using raster data. Focus on satellite imagery, elevation models (DEMs), land cover, or pixel-based art. |
| 30-11-2025 | Makeover | Take a map you made during the month or an older piece and redesign it. Focus on improving the aesthetics, clarity, or data communication. |
The idea is to create maps based around different themes each day of November using the hashtag #30DayMapChallenge. You can prepare the maps beforehand, but the main idea is to publish maps on the dedicated days. Just include a picture of the map when you post to X/Instagram/Linkedin (or your preferred social media platforms) using the hashtag. You don't have to sign up anywhere to participate. There are no restrictions on the tools, technologies or the data you use in your maps. Doing less than 30 is also fine. See the Code of Conduct at the bottom of the page.
Data 🗺↵
You can use whatever data you want. But here are a few sources which could help you to get started or give you new ideas 👇
- OpenStreetMap
- OpenStreetMap (OSM) is a collaborative project to create a free editable map of the world. If you seek for easy ways to get an extract of the data, you can check for GeoFabrik for Shapefiles or Overpass API for GeoJSONs etc..
- Overture Maps Foundation
- OMF publishes global data extracts monthly which are a combination of OpenStreetMap and other open data sources.
- Natural Earth Data
- Natural Earth is a public domain map dataset available at 1:10m, 1:50m, and 1:110 million scales. Featuring tightly integrated vector and raster data, with Natural Earth you can make a variety of visually pleasing, well-crafted maps with cartography or GIS software.
- Free GIS Data
- The site contains a categorised list of links to over 500 sites providing freely available geographic datasets - all ready for loading into a Geographic Information System.
- OS OpenData
- Ordnance Survey Open Data for Great Britain. Includes general topographic map data at a range of scales; useful thematic data such as greenspace, terrain, roads and rivers; postcode and place name georeferencing.
- Humanitarian Data Exchange
- Interesting datasets from around the world.
- LINZ Data Service
- New Zealand land and sea data available for free under a Creative Commons licence via download or OGC APIs.
- LINZ NZ Aerial Basemap
- Current aerial imagery for New Zealand available under a Creative Commons licence via WMTS or XYZ tile services.
- Open Topography
- Lidar point cloud and DEM data.
- A collective list of free APIs for use in software and web development.
- GIS data repositories spreadsheet by Karen Payne
- Data is Plural
- The best data newsletter out there with an awesome archive including also some very obscure datasets.
Tools 🔨🔧↵
The challenge is open to any software, but here's a list of popular open-source tools to consider. No programming skills are required. Or if you are a programmer, no design skills are required.
- QGIS
- A Free and Open Source Geographic Information System. A desktop software that allows you to read/write multiple data formats and output (mainly static) maps.
- Kepler
- Open source geospatial analysis tool for large-scale data sets and for interactive maps.
- Aerialod
- Not really a GIS tool, but can be used to create some stunning 3D visualizations
- Blender
- Free and open source 3D creation suite. Check out the BlenderGIS extension.
- R packages for geospatial
- Python packages for geospatial
- geopandas, xarray-spatial, matplotlib, geoplot, hvplot and plotly to mention a few.
- Mapshaper
- Useful for geospatial data processing in the browser such as file format conversion, map projection, feature simplification, filtering, clipping, merging etc. Can also be run locally from the command line.
- Vega-Lite
- Declarative visualization specification including cartographic output. Specifications can be written directly in JSON or via program language interfaces such as altair (Python) and elm-vegalite (Elm). See, for example, this tutorial on using OpenStreetMap with elm-vegalite
- Vega
- More flexible but lower-level declarative visualization specification including cartographic output. Specifications can be written directly in JSON or via program language interfaces such elm-vega.
- Litvis
- Literate Visualization notebook environment optimised for specifying visualizations and documenting the design process. While not specific to cartography, can be a useful environment for exploring cartographic design.
- Observable
- Reactive notebook environment for generation of visualization and cartographic output embedded in a textual narrative. Focus is on using d3 for specifying visual output.
Tutorials & Helpful Resources 📚↵
If you want to make maps with QGIS, this video is a great starting point. Check out also other videos by Klas Karlson - Steven Bernard's QGIS Introduction - QGIS Tutorials by Ujaval Gandhi - 3D Landscape Tutorial by Alasdair Rae - Basics of Mapmaking by Kenneth Field
Maps & Stats↵
Every year the challenge gathers thousands of mappers around the globe. As the challenge has spread across various platforms, gathering statistics has proven to be nearly impossible. Challenge has been happening since 2019 and the total number of maps created is more than 50,000.
In 2021 there were more than 1200 mappers and more than 9000 maps created for the challenge. In 2020 more than 1000 people posted more than 7000 maps for the challenge on different platforms. If you want to see some maps from past challenges, browse the hashtag on X or check the official website of the challenge and browse different years.
#30DayMapChallenge bot by Haifeng Niu harvested comprehensive stats and maps from the challenge
In 2020 & 2019 David Friggens did a huge lift on the 30DayMapChallenge2020Metadata repository with metadata & interactive gallery.
Code of Conduct↵
No matter if you are a GIS expert or never made a map before this challenge, everyone is welcome to participate,
But keep in mind a few things: - All maps you publish have to be your original work. Don't steal content from others. - Give credit to the original data source whenever possible. - The challenge is all about creativity, openness and the joy of beautiful maps and cartography. It is not a competition, - Be mindful in how you use AI tooling. If you generate all of your maps with generative AI tools, where's the fun? This is not a prompt engineering challenge. - Don't be an asshole. Don't harass or steal from others.
Inspiration for the challenge came from Inktober and Tidy Tuesday.
Merchandise↵
Get your official #30DayMapChallenge stickers from Redbubble.